About This Set
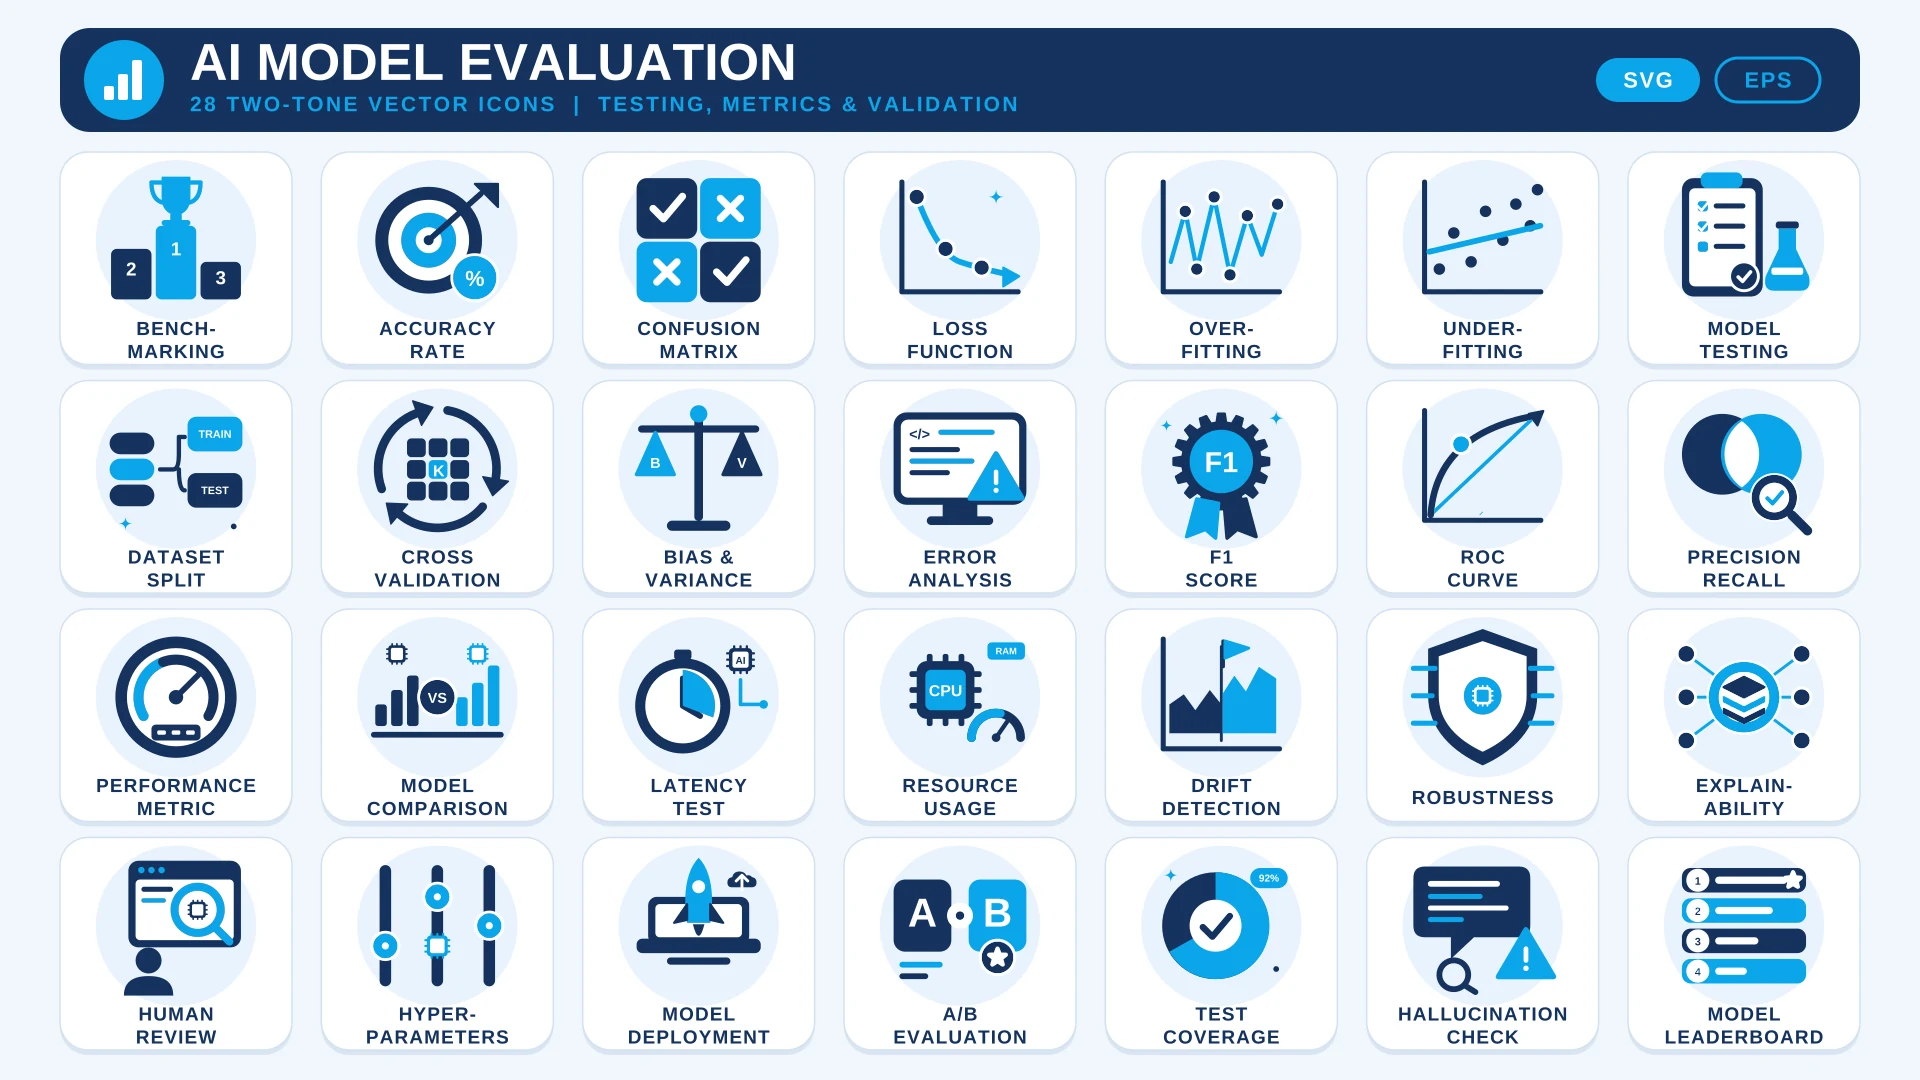
Good AI starts with honest measurement. This set gives you 28 icons for the metrics and methods used to test models: Accuracy Rate, Confusion Matrix, F1 Score, ROC Curve, Precision Recall and Loss Function.
It also covers the problems evaluation is meant to catch, such as Overfitting, Underfitting, Bias & Variance, Drift Detection and Hallucination Check, and the process around them: Dataset Split, Cross Validation, Hyperparameters, Model Comparison, Model Deployment and Model Leaderboard. All icons share one navy and sky blue style on a soft round background, and the SVG and EPS files are editable vectors.
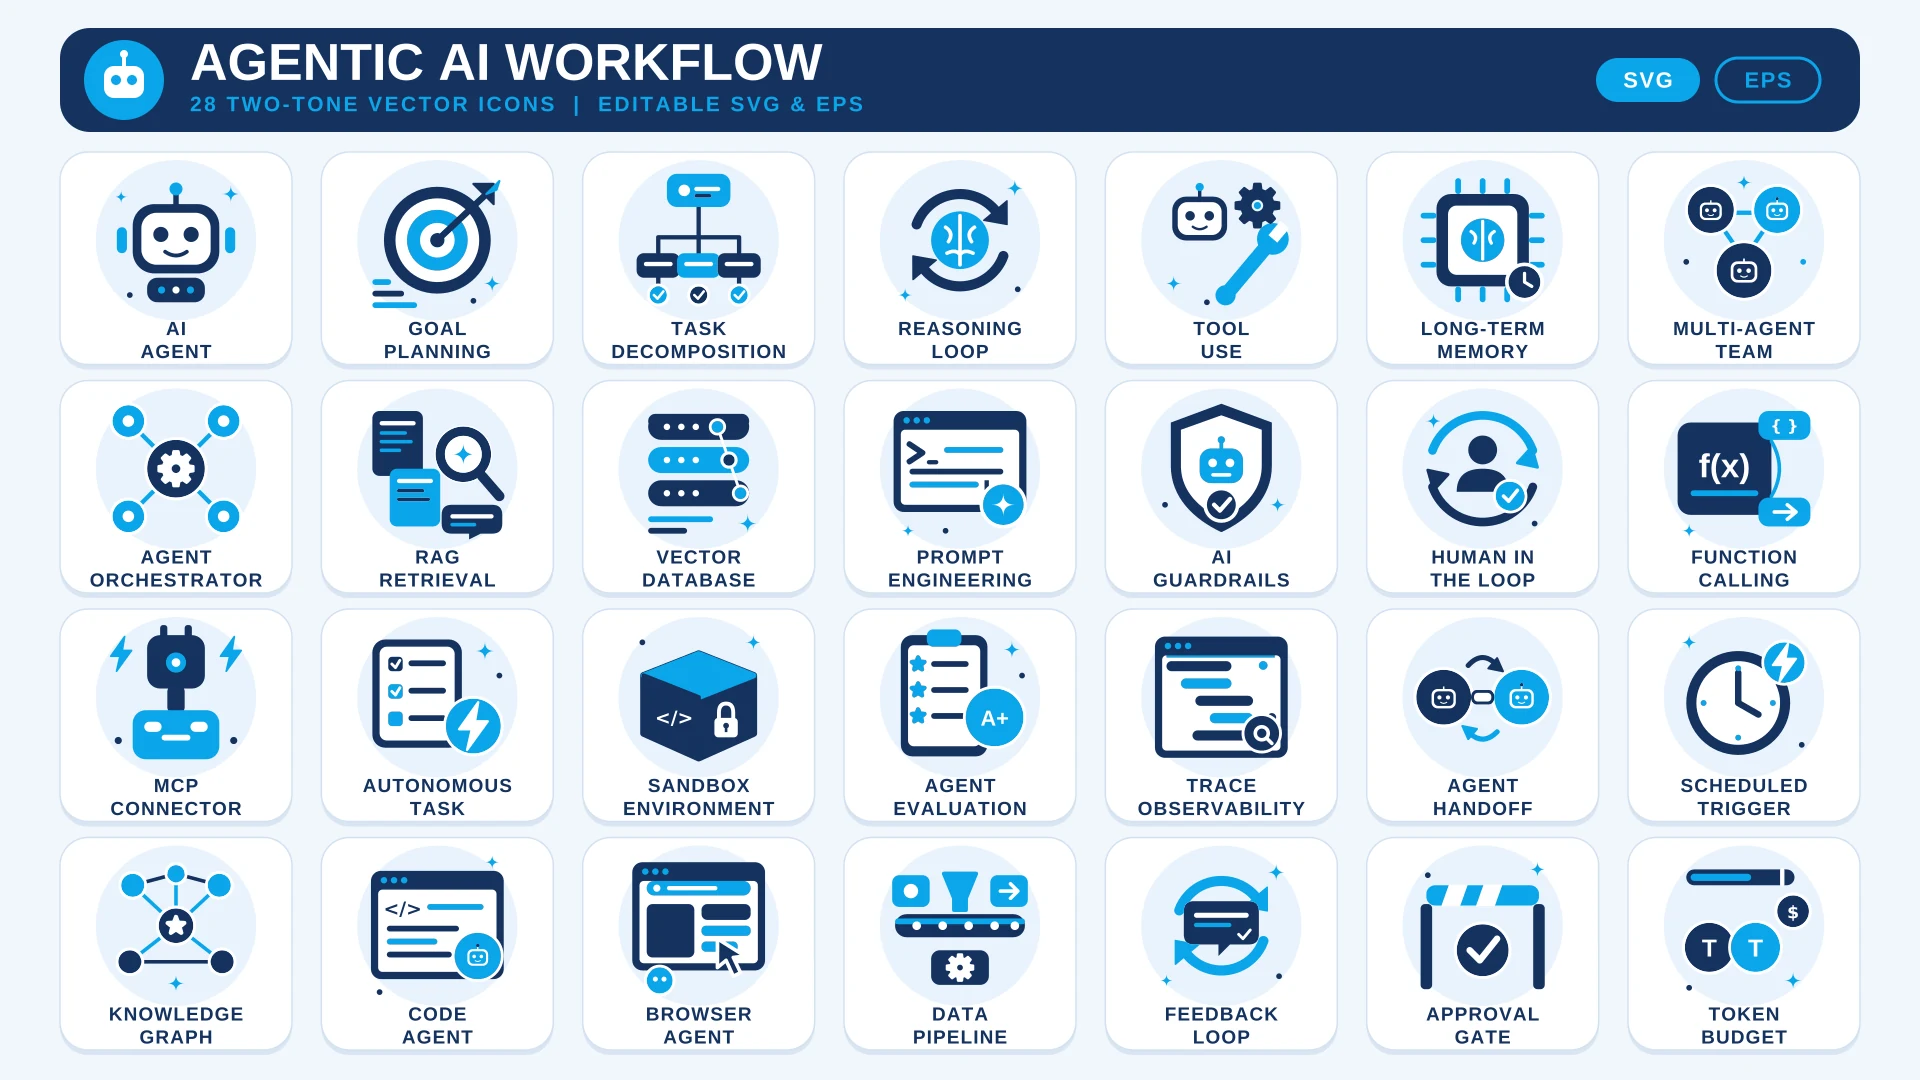
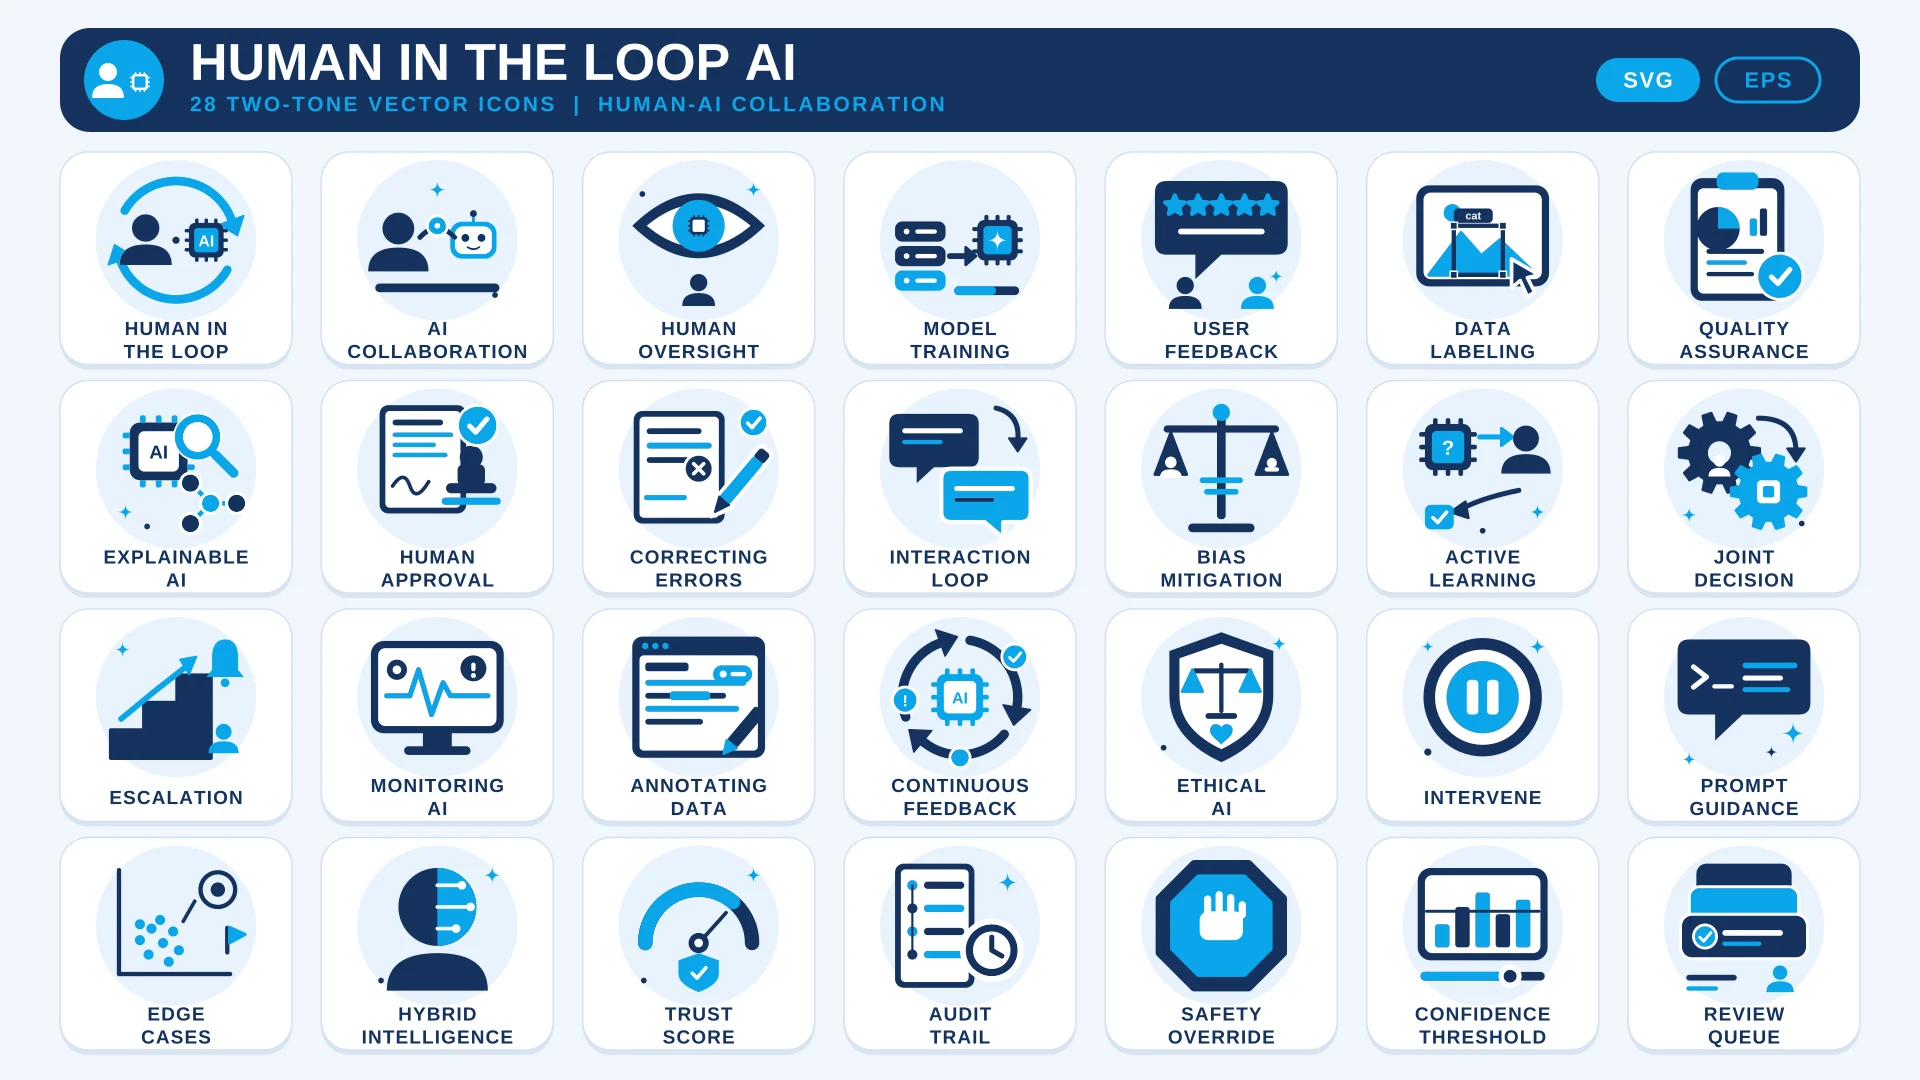
To keep people involved in review, add the Human in the Loop AI Icon Set. For agent-specific testing, see the Agentic AI Workflow Icon Set.
Where to Use It
- Machine Learning DocumentationMark sections on cross validation, loss functions and hyperparameters.
- Evaluation DashboardsUse the accuracy, latency and resource usage icons on metric cards.
- Research Papers and PostersAdd clear visuals to figures about benchmarking and error analysis.
- Team and Stakeholder DecksExplain a model comparison or leaderboard in plain pictures.
- Courses and WorkshopsTeach overfitting, underfitting and drift with one icon for each idea.
Questions About This Set
Which evaluation topics are covered?
The 28 icons include Benchmarking, Accuracy Rate, Confusion Matrix, Loss Function, Overfitting, Cross Validation, F1 Score, ROC Curve, Drift Detection, Hallucination Check and Model Leaderboard.
Can I use them in a product dashboard?
Yes. Commercial use is free with a credit link to HandyIcons in your footer or credits page.
Can I edit the icons?
Yes. The SVG and EPS files are editable vectors, so you can recolour or resize them.
Are they suitable for academic posters?
Yes. Use the EPS or PDF for print. Please add the credit if the poster is published commercially.
 AI Workflow Icon Set
 Agentic AI Workflow Icon Set
 Human in the Loop AI Icon Set